Where the AI Search Statistics You Keep Quoting Actually Came From
· Published August 4, 2026 · Updated August 19, 2026 · 5 min read
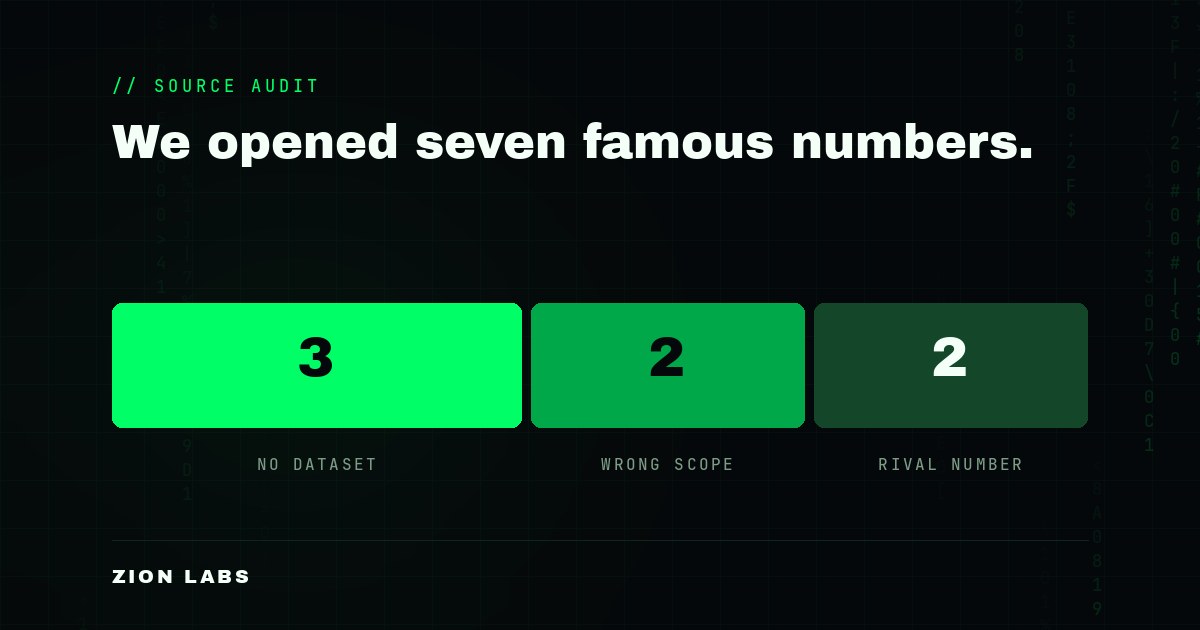
We opened the studies behind seven of the most repeated figures in AI search optimization. Three come from datasets that are published nowhere outside a single article. Two are quoted with the wrong scope attached. Two have a competing figure the same source published, and only the more useful one travels.
Almost none of this is fabrication. Nearly every figure below was measured competently and reported accurately by the person who ran it. What breaks is the next hop: the qualifying clause gets left behind, and by the third retelling the number is arguing something its own sample cannot support. This is about a citation chain with no error correction in it, not about any individual. Our own published mistakes are at the end, with the numbers.
The seven figures
Each has its own page with the full sample, method, publisher, date and honest version.
| The figure as quoted | What was actually measured | The honest version |
|---|---|---|
| 85% of AI brand mentions are third-party | AirOps, 21,311 brand mentions, October 17, 2025, scoped to discovery and early vendor consideration | True for discovery queries. It is requoted as a high purchase-intent finding, which is the other end of the funnel |
| Three findings with no inspectable dataset | The Consensus Gap (Omnia, 3.7m URL citations), the 44.2% ski ramp (Gauge, 18,012 citations), the 74% shortlist figure (Citation Labs, 48 participants) | Cite as “reported by Kevin Indig from data supplied by [vendor]”, never as an industry finding |
| 84% of AI citations are earned media | Muck Rack Generative Pulse, 25m+ links, May 7, 2026. Earned media is a bucket defined by exclusion | Journalism alone is 20% to 27%. If the pitch is press coverage, 27% is the number |
| 82% of AI citations are third-party | Aleyda Solis, 45 brands, August 2, 2026. Top 10 cited source domains per brand, hand-classified | A slot share, not a citation share. Owned domains hold 10% to 11% of slots and 20.6% of mention weight in finance |
| Reddit is 54% to 71% of AI sources | Cornell Tech preprint arXiv 2605.24245, May 22, 2026, three academic research pipelines | Roughly 12% to 13% of retrieved URLs, and not measured on any production engine |
| Trustpilot lifts citation rates from 1% to 75% | Seer Interactive for Trustpilot, 804,491 AI responses, March 2026, unmatched tiers | The study’s own matched cohort of 206 brands per tier shows 6 percentage points, and the full matched table was not published |
| 76% of AI Overview citations are top 10 | Ahrefs, 1.9m citations, July 2025, asking what share of cited pages rank top 10 | Ahrefs now reports 38%, and 12% when measured against the prompt the user actually typed |
Two patterns run through all seven: a lost denominator, where a share of one class becomes a share of everything, and a lost qualifier, where a funnel stage, market, participant count or engine stated at source does not survive the retelling.
A note on Kevin Indig
Several figures in this audit reach the industry through Kevin Indig’s Growth Memo, and he is, in our reading of the field, the most rigorous practitioner publishing in it. He names his data partners, states his samples, publishes his geographic limits, and instructs readers to treat his most-quoted finding as directional for one region rather than as a global fact.
That is exactly why his figures appear here. A scope loss in a widely read, carefully disclosed piece matters more than one somewhere with fewer readers, because the careful version is what everyone copies from. In every case here the caveat was published and the requoters dropped it. The problem is not the author. It is that a qualifying clause has a much shorter half-life than a number.
Where our own published numbers have been wrong
We have made every category of error in this piece, some of them in the same week we wrote it: a correlation computed across a compressed range, a rubric that rewarded a page with two words on it, a scoring method that flattered partially measured sites, and a study we published and retracted three times in one day.
They are written up with the numbers in Four numbers we published and had to correct. The common cause was writing first and stress-testing only when challenged, which is why a research brief now precedes any study and a content brief precedes any piece. This one has both.
Four questions to ask of any AI search statistic
- What is the denominator? This is where most drift lives. A share of user-generated content is not a share of all sources, and a share of top cited domains is not a share of citations.
- What funnel stage, market and engine? Findings scoped to discovery get quoted at purchase. Findings from a Spain-weighted pool get quoted as global.
- Is it a prevalence ratio or a lift? A prevalence ratio compares two different populations and has no counterfactual, so it cannot tell you what happens if you change the page.
- Does the dataset exist outside the article? Three of the most cited findings in this field do not.
If a figure survives all four, use it. Most do not survive the first.
How we checked
We opened the studies rather than the summaries: fetch the primary source, read the sample and the caveats, compare against the sentence quoting it, record where they diverge. A source we could not reach is recorded as not read, never inferred.
What we did not do is measure how often the drifted version is used relative to the accurate one. We have examples of drift, not a prevalence measurement of it. Claiming otherwise would be the exact error this piece is about.