Do Trustpilot Reviews Raise Your AI Citation Rate?
· Published August 4, 2026 · Updated August 19, 2026 · 4 min read
The figure as commonly quoted: brands with no Trustpilot profile are cited in AI answers 1% of the time and brands with a high-volume managed profile are cited 75% of the time, therefore managing reviews raises AI citations.
The sample behind it is genuinely large. The comparison is between two groups that differ in more than one way.
What the source actually measured
Seer Interactive ran a study commissioned by Trustpilot, published in March 2026, covering 804,491 AI responses across 1,926 brands.
| Publisher | Seer Interactive, commissioned by Trustpilot |
| Date | March 2026 |
| Sample | 804,491 AI responses, 1,926 brands |
| Prompts | 15,783 unique prompts across 8 verticals |
| Engines | ChatGPT, Google AI Mode, Gemini, Perplexity |
Brands were sorted into four tiers by Trustpilot activity, from no verified profile up to high-volume actively managed. The headline picked up widely was a median AI citation rate of 1% for the bottom tier and 75% for the top.
Where the quoted version and the source diverge
The tiers are not randomised and not matched. Whether a company runs a high-volume actively managed review profile is close to a proxy for whether it is a large consumer-facing company with a marketing department. So the comparison is substantially between big brands and small brands, with the gap reported as a review-profile effect.
The authors half acknowledge this, noting that other factors such as marketing spend and audience size may have influenced the rates.
The decisive detail is that they built the right analysis and did not publish its output. The study describes constructing a stricter Domain Rating cohort of 206 brands in each tier, specifically to isolate the effect of Trustpilot from organic strength. That is the correct move, and it is the analysis that would answer the question the headline asks.
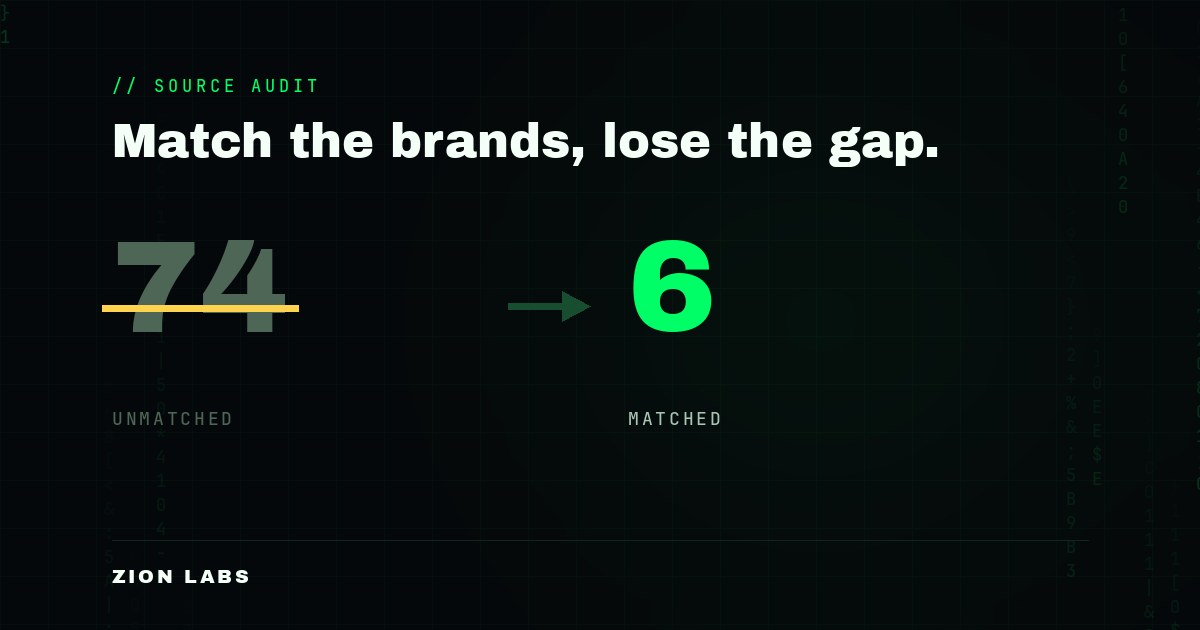
The tier-by-tier citation rates from that matched cohort are not published. The only matched figure disclosed is the top tier outperforming the second tier by 6 percentage points, against a 74 point unmatched headline gap. We verified this by reading the study page directly on August 4, 2026.
A 74 point gap that shrinks to 6 points once brand strength is held constant is the shape you would expect if most of the original gap was brand strength. That is an inference, not a finding, because the numbers that would confirm it were not released.
There is also a direction-of-causation problem the tiers cannot resolve. A brand that is already widely discussed accumulates reviews without asking for them, so review volume is partly an output of brand size rather than an input to it. Sorting brands by review activity therefore sorts them partly by the thing you are trying to measure the effect on, and no amount of sample size fixes that. Only matching does, which is why the matched cohort was the analysis worth publishing.
On the commission
State the incentive plainly and leave it there: this was commissioned by the company whose product is the independent variable. That does not make the measurement wrong, the sample is genuinely one of the largest in this literature, and Seer disclosed both the confound and the existence of the matched cohort, which many commissioned studies would not have done.
It does mean that when a confound-controlled analysis is run and only the uncontrolled headline is published, the reasonable inference is about what the controlled version showed. The missing table is itself evidence.
The honest version of the claim
Do not use the 1% to 75% comparison. It compares large consumer brands with small ones and labels the difference a review effect.
If a review-profile effect exists at all in this data, the study’s own best evidence for its size is 6 percentage points, between the top two tiers, in a cohort of 206 brands per tier matched on Domain Rating. That is a real and usable number. It is also a very different business case from the one the headline supports, and it is the one the authors were careful enough to build.
If you want the full matched result, ask Seer or Trustpilot for the tier-by-tier rates from the 206-brand cohort. If they are published we will update this page.
This page is part of Where the AI Search Statistics You Keep Quoting Actually Came From, an audit of seven of the most repeated figures in AI search optimization, with the checks we run on each one.